Tag: how to develop insight
Top 10 Marketing Infographics to Smash 2018 (Inspiration for the Visual World)
One of C3Centricity’s annual traditions is to publish a post which shares the best marketing infographics of the previous twelve months.
Here is this year’s crop, with ideas on how you can get inspired to take action in your own marketing.
Interestingly, many marketing infographics that have been shared in the past year are actually about content marketing. It’s as if “true/traditional” marketing doesn’t exist any more. That in itself says a lot about the focus of marketers these days! Are they right to do so? I don’t think so, but let me know your opinion.
In the same way that new media channels were separated from traditional channels for a while. it seems that content marketing has also been separated from traditional marketing. This is wrong from my perspective, because content marketing has always existed, whether through communications on pack, in advertising or more recently on websites.
Anyway, here is this year’s crop of the best marketing infographics around. If yours is not among them then please add a link to your preference in the comments below.
The Most Shared Marketing Infographics of 2017
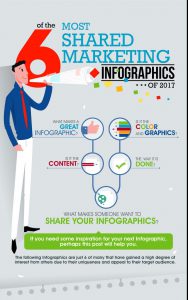
It makes sense that I start this post by taking a look at the most shared marketing infographics of last year. What is great about this post is that it is itself an infographic! It explains what makes a shareabale infographic.
Take a look at the six most shared posts and draw inspiration from their ideas, to create your own.
(Click image to see full infographic)
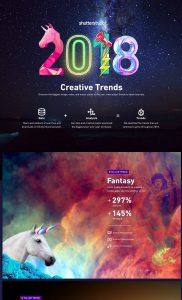 With the rapid expansion in offers online, websites can no longer satisfy their audience by just adding content. They need to regularly update their design too, to stay fresh and appealing to changing preferences. (C3Centricity does this annually; le me know what you think when we relaunch our new design in a couple of weeks)
This infographic summarises beautifully the trends for the coming year. Check your own site against these images and if you find yours lacking in any way then an update should be planned – sooner rather than later!
(Click image to see full infographic)
The Meaning of Colours by Culture
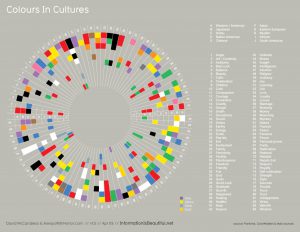 If you work globally then you already know that while we are all human beings, we are not all the same. This is particularly true in terms of our associations with colour.
These differences come from a wide variety of sources; from tradition, to history and even from the impact of the most popular brands.
So it is important that if you are responsible for a brand globally, or sometimes even regionally, that you understand the nuances in interpretation of your brand’s pack and communication by the colours used.
This infographic, while it may seem complex at first view, will become your best friend once you understand how to look at it.
(Source: Information is Beautiful)
(Click image to see full infographic)
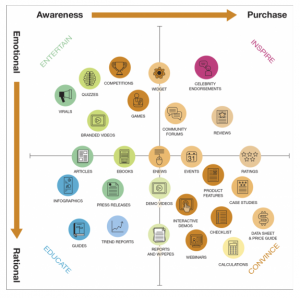
Content Marketing Uses
This is a … Click to continue reading
Customer Centricity is Today’s Business Disruptor (Insights are its Foundation)
I recently returned from a speaking invitation in Las Vegas. It was an incredible Symposium run by Sitecore, and I was blown away by the importance placed on customer-centricity during the whole event!
From the opening keynote by Sitecore’s CEO Mark Frost to the second-day keynote by Kirsten Newbold-Knipp from Gartner, everyone in this tech and data-heavy conference understood that data is only as good as the use you put on it. Do you?
We are all excited by the wealth of information available to us about our customers, from the IoT as well as people’s behaviour on the internet. In fact, data gathering is no longer an issue; it is its management, analysis and, above all, understanding to turn it into actionable insights that is today’s challenge.
I believe that the reason most organisations today are drowning in data and thirsting for insights, as I am often quoted as saying, is because they are more excited by data than people.
“Organisations are drowning in data and thirsting for insights”
And yet data usually comes from people and their acts and is analysed by people, so that businesses can have more impact on their customers’ attitudes and behaviours. It is, therefore, vital to turn that wealth of information into actionable insights. That’s why I want to share my 7-step process for doing just that with you.
I call it Catsight™, and the acronym always causes a few giggles, as I’m sure you can imagine. After all, business is a serious topic, which is why I try to find ways for us all to find reasons to laugh in all this seriousness.
I chose the name Catsight™ because I thought it is memorable and has a serious relevance to what insight developers do.
Cats have an acute vision, particularly in the dark. They are good at listening because their ears turn 180 degrees. They are highly sensitive – just ask an owner how their cat reacts when they are sad or ill.
Seeing in the dark, listening skills, sensitivity and empathy for the customer are essential skills for all insight developers.
So here are my seven steps to actionable insight development. Note that information gathering is only step #6!
If you react to business questions immediately by running a market research project, please read on. It could save you a lot of money and time!
Using my method, you only start spending money on running a survey in step six – and only if you have identified a gap in your knowledge of the situation. Many organisations don’t know what they already know and what is already available within the company that they are unaware of.
This 7-step process will save you money because you will run less research AND make better use of all the information already available within the organisation. That’s an immediate improvement in the ROI of your information gathering.
C = Category
Whenever you want to develop insight, the first task is to decide on the category … Click to continue reading


